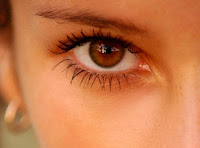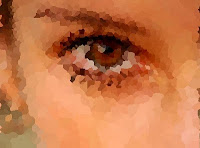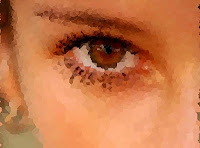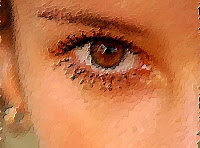


Top Left: The source image (600 x 446 JPEG). Top Right: The same image as a collage of 2407 Voronoi cells. Lower Left: 5715 cells. Lower Right: 9435 cells, embossed. Click any image to see a larger version.
A Voronoi tessellation is a factoring of 2-space into polygonal regions that enclose points (one point per region) in such a way that the boundary between two adjoining regions runs at a perpendicular to the (imaginary) line connecting the nearest two points, while also being midway between the two points. In the simplest case, a set of points S ("Voronoi sites") defines a corresponding number of cells V(s), with any given cell consisting of all points closer to s than to any other site. The segments of the Voronoi diagram are all the points in the plane that are equidistant to the two nearest sites.
If you look at the points in the diagram below, you can see that an imaginary line connecting any two neighboring points will be bisected at a right angle by a cell boundary; and the cell boundary will be exactly midway between the points. That's what makes a Voronoi cell a Voronoi cell.
Voronoi diagrams are named after Russian mathematician Georgy Fedoseevich Voronoi, but their use dates back hundreds of years. Descartes was already familiar with them in 1644. British physician John Snow supposedly used a Voronoi diagram in 1854 to illustrate how the majority of people who died in the Soho cholera epidemic lived closer to the infected Broad Street pump than to any other water pump.
The dual graph for a Voronoi diagram corresponds to the Delaunay triangulation for the same set of points. Delaunay is an interesting construction in its own right, but we'll save it for another day. For now suffice it to say that Delaunay offers a way of taking a field of (coplanar) points and making them into a field of triangles composed in such a way that the circumcircle inscribed by any given triangle encloses no other points.
Voronoi-tessellated forms tend to be aesthetically pleasing -- if the tessellation is done so as to produce more cells in areas high in detail, and fewer cells in low-detail areas -- although not always fast. Tessellation of a point-field into Voronoi cells generally takes (depending on the algorithm) either N-squared or N-log-N time (meaning, it can be quite slow if the number of points is large).
Fortunately, we can take advantage of a space-filling trick to make the whole process occur in linear time (i.e., time-order ~20N to 30N, in practice).
To see how the algorithm works, imagine, if you will, a field of points. Let each point magically become a soap bubble. Now grow each bubble slowly. When two bubbles meet, their walls fuse together into one flat section that joins the two, with a boundary that's perpendicular to the (imaginary) line connecting the centers of the bubbles. (If you've seen two bubbles stuck together, you know what I mean. There's a "flat" side to each bubble where they join together.) Continue to grow all bubbles until there are no more curved edges; only flat walls. This is the approach we use. We take a field of points and dilate them (grow them in all directions at once) until they become regions that adjoin. If all regions grow at the same speed, natural boundaries will form, and those boundaries will define Voronoi cells.
But how to redefine an image as a series of points? Easy: Just take random samples of the image. Actually, for the most visually pleasing result, we don't want random samples: We want to take more samples in areas of high detail and fewer samples in areas of gradual color change. This is easy enough to do with an algorithm that walks through the image, looking at how much each pixel differs from the pixels around it. We accumulate the variance into a "running average," and when that number exceeds a certain arbitrary threshold, we take a sample; otherwise, set visited pixels to white.
The JavaScript below shows how it's done. The loadSamples() method walks through the image, taking samples of pixel values -- more frequent samples in rapidly-fluctuating areas, less frequent samples in areas of little variation. Once a field of samples has been captured, we call the spaceFill() method, which dilates the points by growing them in north, south, east, and west directions until the image space is filled. I do frequent checks to see if we're done filling (in which case we break out of the loop). Generally, if the average cell size is small enough to give a pleasing visual appearance, the whole image can be filled in 30 iterations or so. Smaller (more numerous) cells can be filled quickly, hence fewer iterations with more cells. (Sounds counterintuitive at first.)
Note that to run this script, you may want to use the little ImageMunger app I gave code for in a previous post. (ImageMunger will open an image and run a script against it. Along the way, it puts Image and Panel globals in scope at runtime. See previous post for details.)
Unaccountably, I found that this code runs much faster using the separate Mozilla Rhino js.jar than using JDK6's onboard script engine. (When I say "much faster," I'm talking the difference between six seconds and two minutes.) I didn't try to troubleshoot it.
To get more Voronoi cells (finer granularity of resolution), decrease the value of the SENSITIVITY constant. A value around 4 will yield a point field with a density of around 3 percent -- in other words, 3 point samples per 100 pixels. To get half as many samples, double the SENSITIVITY value.